The VF360 GLOBAL USER SYSTEM Reports
![]() Table sorting, filtering and search
Table sorting, filtering and search
Sort
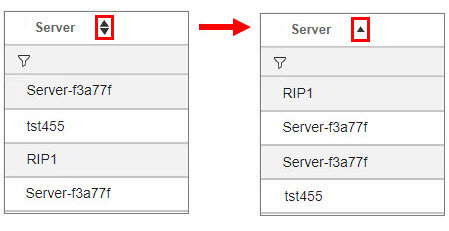
You can order the tables by the columns which include ![]() in the header.
in the header.
After you select the ![]() icon, the sorting icon turns into an ascending or descending icon, showing the sorting order. Select the
icon, the sorting icon turns into an ascending or descending icon, showing the sorting order. Select the ![]() or the
or the ![]() icon to modify the sorting order.
icon to modify the sorting order.
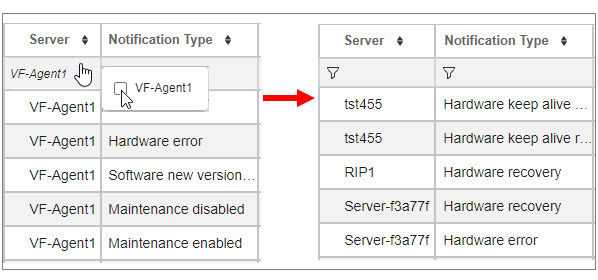
Filter
Limit the displayed items by filtering the display (![]() ).
).
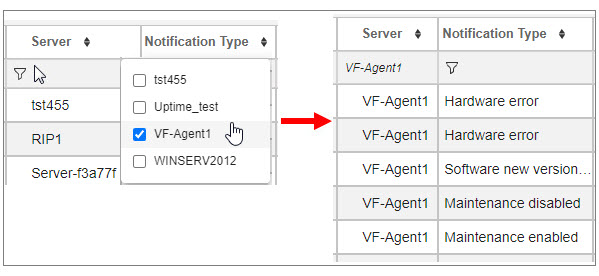
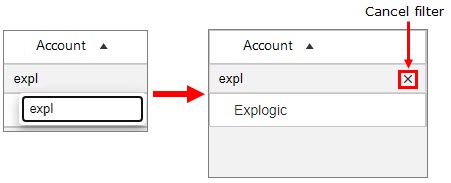
For example, if you want to only display specific accounts, select the table cell where the ![]() icon is, and check the box/boxes of the account/accounts you want to display.
icon is, and check the box/boxes of the account/accounts you want to display.
Click outside the account list to implement the changes.
To cancel a filter selection, select the table cell where the accounts displayed are shown and deselect account name/names you do not want to display anymore.
Click outside the account list to implement the changes.
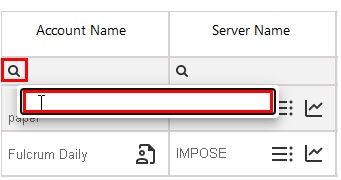
Search
The column search is not dynamic. Select the search icon ![]() , type the text you want to search for and press enter on your keyboard.
, type the text you want to search for and press enter on your keyboard.
|
Field |
Description |
|---|---|
|
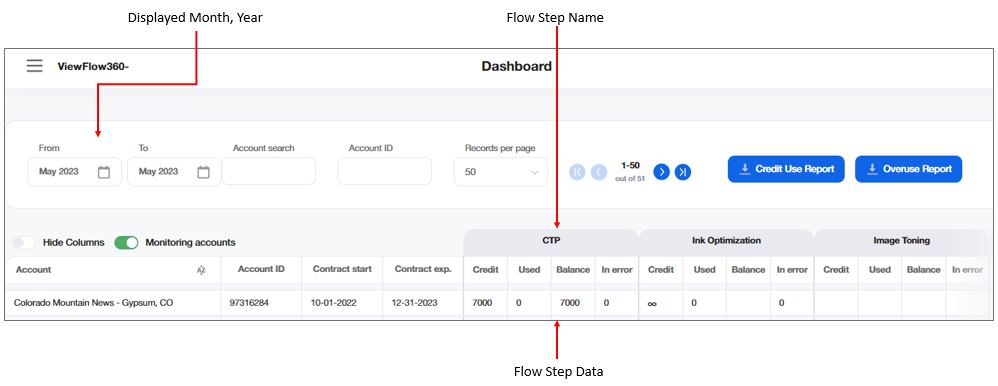
Month, Year |
You can only display the information for one month. Select that specific month in these drop-down lists. |
|
Records per Page |
Select the number of table rows to display at a time. |
|
of x RECORDS |
Displayed records out of the total number of records. |
|
ACCOUNT Search |
Dynamic search bar for account name search. |
|
CREDIT USE REPORT |
Select to generate an Excel file with the overall data available in the Dashboard table. |
|
OVERUSE REPORT |
Select to generate an Excel file with the overage data available in the Dashboard table. if there is overage in one month; however, overall for the chosen period there is no overage, then account does not display in the overage report. |
|
HIDE COLUMNS |
Switch ON to hide the Account ID, Contract Start and Contract Expiration columns. |
|
MONITORING ACCOUNTS |
Switch ON to display the list of monitoring accounts. This hides all accounts that have zero on in all columns in all the steps for the selected period. |
To browse through the pages, use the ![]()
![]() buttons.
buttons.
The table displays the data per publication and per monitored flow step.
|
FIELD |
Description |
|---|---|
|
ACCOUNT |
Account name, as defined in the Company name field in |
|
ACCOUNT ID |
When a system administrator who has permission to create accounts in VF360 enters a new account, they assign this account an ID number which is the same unique number the account has in the Product system, for billing activities, or in any other program which it is part of the software platform. If, for example, in the Apogee system Account1 has the Account ID 1234, they are assigned the same ID (1234) in VF360 also. The Account ID is defined in the Account account. This field only accept digits, a maximum of 10 characters. |
|
Contract start |
The month and the year when the contract for the product usage begins. |
|
Contract expiration |
The month and the year when the contract for the product usage ends. |
For every monitored flow step the dashboard displays the following information:
|
Table Column |
Description |
|---|---|
|
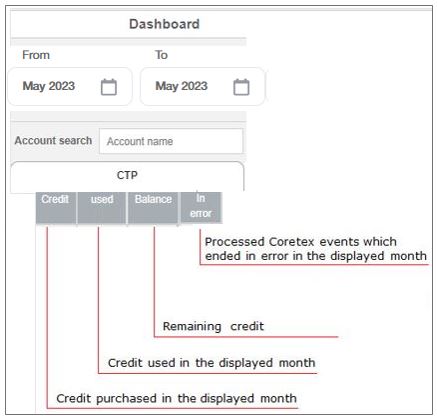
Credit |
The number of events you may process per month, per flow step according to your license, in the selected month. For example, your license allows you to run ink optimization on 2000 files per month in the Optimization flow step, or you may output 500 plates in the CTP flow step, and so on. Infinite means that for the specific flow step, the user has unlimited usage. |
|
Monthly used |
The number of events you have processed in the selected month.
|
|
BALANCE |
The remaining credit, calculated as the monthly credit amount set in the respective Account minus the number of processed files. |
|
past 12 mo |
The number of events you have processed during the past 12 months. |
|
IN ERROR |
The number of events which ended in error in the displayed month. |
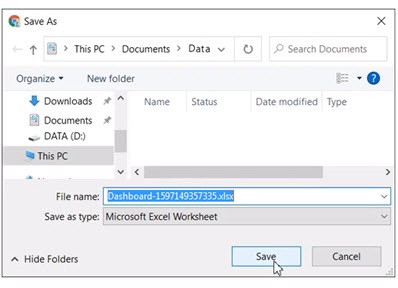
You can export the data in the table to an Excel file by selecting the ![]() or the
or the ![]() icon and saving the Excel file under a name and in a location of your choice.
icon and saving the Excel file under a name and in a location of your choice.
The up time is the time a server or a software system is up and running. It is calculated based on the parameters reported by the monitoring agents.
The monitoring agent is a software program which is installed on different computers at the account's premises (for example the CTP computer, the RIP computer and so on) and monitors the activity of the CPU, memory, installed programs, and so on. The monitoring agent continuously sends a keep-alive type of signal to VF360, so that when that signal stops arriving at VF360, it means the server on which the monitoring agent is installed, is down. There are also keep-alive signals for software programs, which may or may not be identical to the server's keep-alive.
![]() For the monitoring agent to report keep-alive for a program, that program must also include the necessary software which connects it to the monitoring agent.
For the monitoring agent to report keep-alive for a program, that program must also include the necessary software which connects it to the monitoring agent.
The monitoring agent can also provide alerts when there is unusual activity on the computer, for example the CPU load or the memory usage are too high, the server is down, software programs have stopped working, and so on.
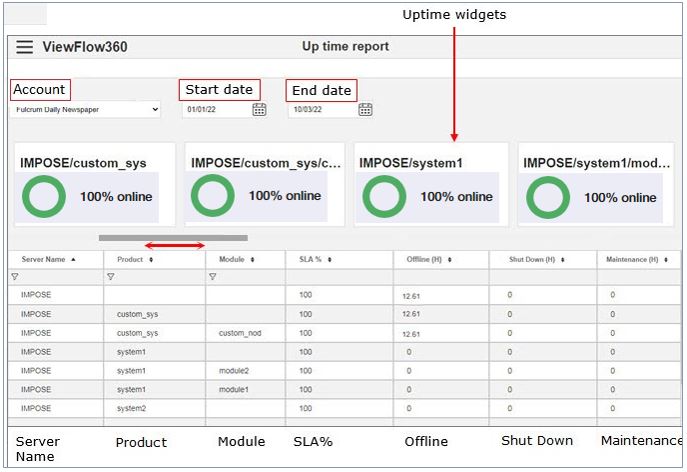
![]() Use the horizontal scroll bar to view all the uptime widgets.
Use the horizontal scroll bar to view all the uptime widgets.
|
FIELD |
DESCRIPTION |
|---|---|
|
ACCOUNT |
The account whose Up Time to display, as defined in the Company name field in |
|
START DATE |
The start date of the report's period. |
|
END DATE |
The end date of the report's period. |
|
SERVER NAME |
The name of the monitored server. |
|
PRODUCT |
The monitored software system. |
|
MODULE |
The monitored module inside the product. |
|
SLA% |
The service level agreement (SLA) is usually part of the contract between a service provider (for example a software developer) and its clients and measures the overall project performance, usually with industry-approved metric. The Up Time percentage guarantee is part of the SLA agreement and indicates the amount of time the computer is operational, the services are running and are accessible to the account. SLA = 100 - downTime / (totalTime - maintenanceTime - shutdownTime) * 100 |
|
OFFLINE (H) |
The downtime (measured in hours). |
|
SHUT DOWN |
The number of hours server was shut down during the selected period. |
|
MAINTENANCE |
The number of hours server had scheduled maintenance during the selected period. |
![]() You can order the table by each of the columns. You can also choose to filter the display (
You can order the table by each of the columns. You can also choose to filter the display (![]() ) to only show specific servers, systems, or modules. By limiting the display you also limit the number of widgets which appear on the screen, eliminating the need to scroll horizontally to see all of them.
) to only show specific servers, systems, or modules. By limiting the display you also limit the number of widgets which appear on the screen, eliminating the need to scroll horizontally to see all of them.
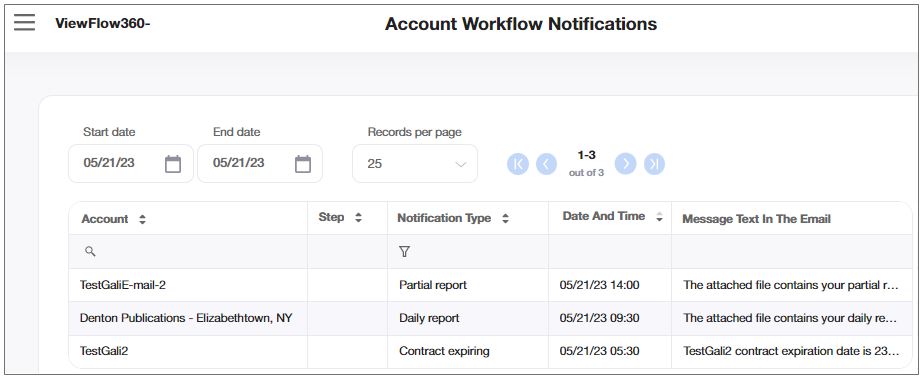
The account workflow notifications report sums up all the notifications regarding the workflow which VF360 sent to all the accounts by email within the time period between Start Date and End Date.
You can select in the drop-down list in the Records per Page field the number of table rows you want to display on the screen at a time. To browse through the pages, use the ![]()
![]() buttons.
buttons.
Set the period for which you want to display the data in the Start Date and the End Date fields.
|
FIELD |
DESCRIPTION |
|---|---|
|
ACCOUNT |
The account whose notification is displayed, as defined in the Company name field in |
|
STEP |
The flow step the notification refers to. |
|
NOTIFICATION TYPE |
The type of notification sent. Options:
|
|
DATE AND TIME |
The date and time the report was issued. |
|
MESSAGE TEXT IN THE EMAIL |
The text message sent by email. |
![]() Hover your mouse over a table cell which is not wide enough to show the whole entry and a tool tip shows the entire text.
Hover your mouse over a table cell which is not wide enough to show the whole entry and a tool tip shows the entire text.
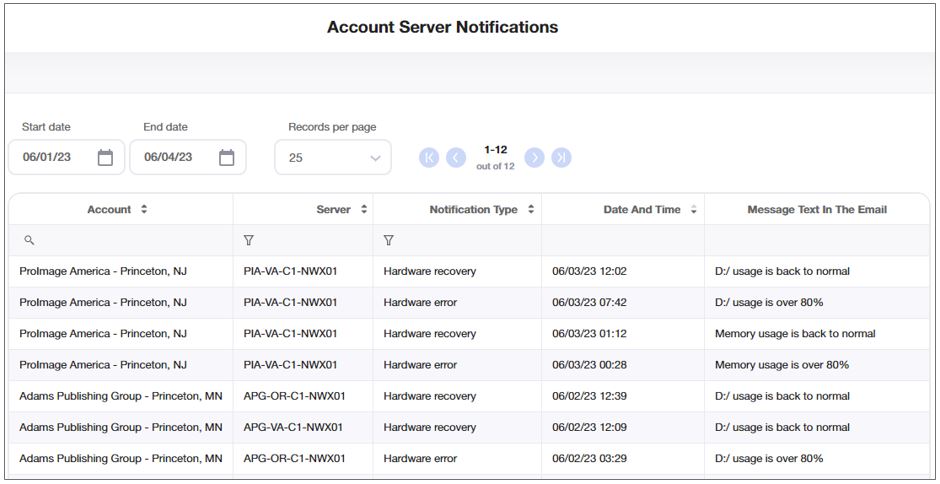
The account server notifications report sums up the history of all the notifications regarding the servers, which VF360 sent to all the accounts by email within the time period between Start Date and End Date.
You can select in the drop-down list in the Records per Page field, the number of table rows you want to display on the screen at a time. To browse through the pages, use the ![]()
![]() buttons.
buttons.
Set the period for which you want to display the data in the Start Date and the End Date fields.
The default display is ordered by the Date and Time of the report.
|
FIELD |
DESCRIPTION |
|---|---|
|
ACCOUNT |
The account whose notification is displayed, as defined in the Company name field in |
|
SERVER |
The server the notification refers to. |
|
NOTIFICATION TYPE |
The type of notification sent. Options:
|
|
PRODUCT |
The monitored software program. |
|
MODULE |
The monitored module in the product. |
|
DATE AND TIME |
The date and time the report was issued. |
|
MESSAGE TEXT IN THE EMAIL |
The text message sent by email. |
![]() Hover your mouse over a table cell which is not wide enough to show the whole entry and a tool tip shows the entire text.
Hover your mouse over a table cell which is not wide enough to show the whole entry and a tool tip shows the entire text.
This report allows you to see the start and end date of the contract of each account.
You can display the data in the alphabetic order of the account names, by the start date or by the end date.
You can select in the drop-down list in the Records per Page field, the number of table rows you want to display on the screen at a time. To browse through the pages, use the ![]()
![]() buttons.
buttons.
Set the period for which you want to display the data in the Start Date and the End Date fields.
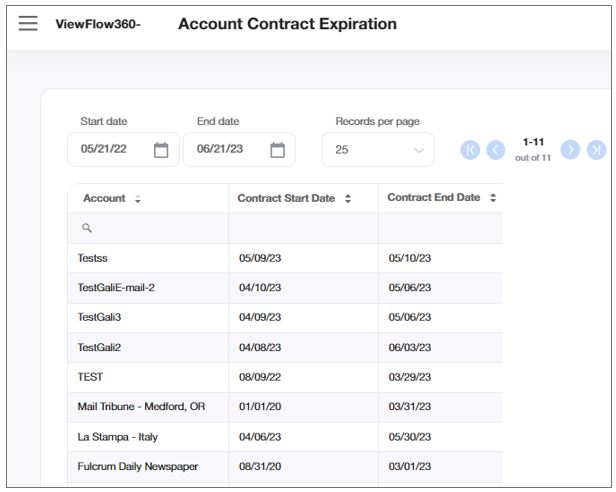
You can search an account's name in the search (![]() ) bar and only display that specific account. To cancel the filter, select the
) bar and only display that specific account. To cancel the filter, select the ![]() icon in the search field.
icon in the search field.
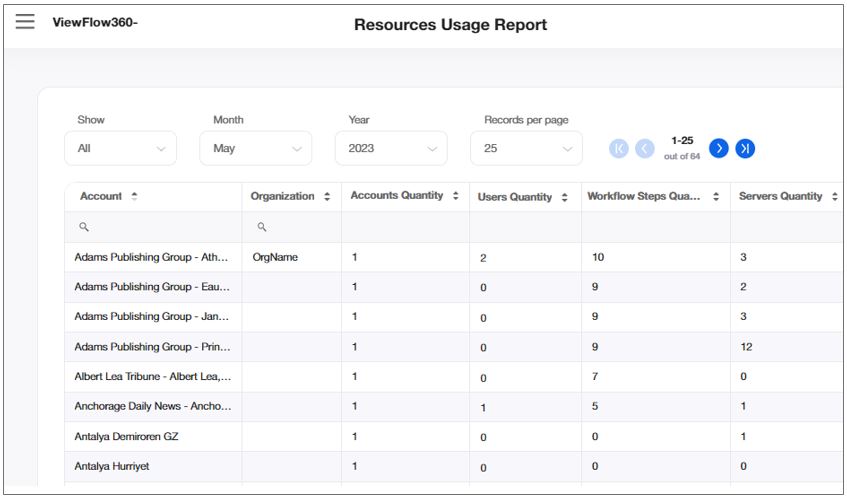
The Resources Usage Report allows you to review all data that was used in the system to get an overview of all system services used / grouped per services, dates, and users.
You can display the data in the alphabetic order of the account names.
You can select in the drop-down list in the Records per Page field, the number of table rows you want to display on the screen at a time. To browse through the pages, use the ![]()
![]() buttons.
buttons.
|
FIELD |
DESCRIPTION |
|
ACCOUNT |
The name of the account. |
|
ORGANIZATiON |
The name of the organization. |
|
ACCOUNTS QUANTITY |
The number of accounts usage |
|
USERS QUANTITY |
The number of users usage. |
|
WORKFLOW STEPS QUANTITY |
The number of workflow steps usage. |
|
SERVERS QUANTITY |
The number of servers usage. |
|
PRODUCTS QUANTITY |
THe number of products usage. |
|
MODULE QUANTITY |
The number of module usage. |
The Workflow Events report allows you to see the number of workflow files utilized for every flow step in the system for the selected period to estimate the performance of the system.
![]() The number shown is the total of events per server and not per tenant.
The number shown is the total of events per server and not per tenant.
The user has one of the following roles:
Monitoring User
Organization Admin
Organization User
Account
Account User
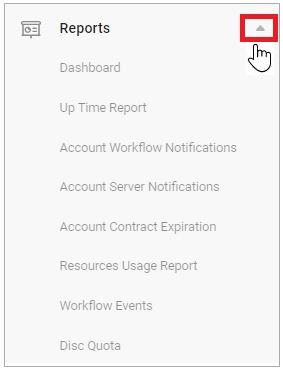
![]() For Admin, Global User, Monitoring User, and Organization Admin the “Workflow Files Monitoring” page is placed in the “Reports” main menu item.
For Admin, Global User, Monitoring User, and Organization Admin the “Workflow Files Monitoring” page is placed in the “Reports” main menu item.
![]() For Accounts, and Account Users the “Workflow Files Monitoring” page is placed in the “Workflow” main menu item.
For Accounts, and Account Users the “Workflow Files Monitoring” page is placed in the “Workflow” main menu item.

For the Workflow Events report, the following list shows the peak value under the Period drop-down list.
1 hour - 12 dots, each dot per 5 minutes. This shows the peak value per minute within 5 Minutes
6 hours - 24 dots, each dot per 15 minutes. This shows the peak value per minute within 15 Minutes
12 hours - 24 dots, each dot per 30 minutes. This shows the peak value per minute within 30 Minutes
24 hours - 24 dots, each dot per 60 minutes. This shows the peak value per minute within 60 Minutes
48 hours - 24 dots, each dot per 120 minutes. This shows the peak value per minute within 120 Minutes
1 week - 24 dots, each dot per 420 minutes. This shows the peak value per minute within 420 Minutes
The “Workflow reporting” product type is enabled for the whole system and for the current user. For more information on “Product Type”, refer Set Up the VF360 System Settings.

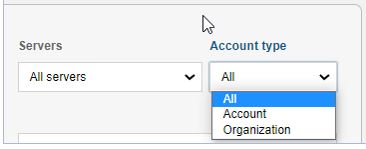
When "All" is selected under "Account type", then Organizations are listed on top of the list followed by Accounts.
|
FIELD |
DESCRIPTION |
|
SERVERS |
Drop-down to show all servers running Monitoring Agent. The list accumulates servers that atleast once connected to ViewFlow360 post upgrade. |
|
ACCOUNT TYPE |
Drop-down to select Accounts of Organizations if created. |
|
TIME |
Server’s time if there is a server in the list. If not, then user’s time according to the User Browser Time. |
The Dis Quota report allows you to see the disc quota analytics for the selected period to assess the server's capacity state.
The user has one of the following roles:
Root Administrator
Global User
The “Workflow reporting” product type is enabled for the whole system and for the current user. For more information on “Product Type”, refer Set Up the VF360 System Settings.
![]() For Admin, and Global User the “Disc Quota" page is placed in the “Reports” main menu item.
For Admin, and Global User the “Disc Quota" page is placed in the “Reports” main menu item.
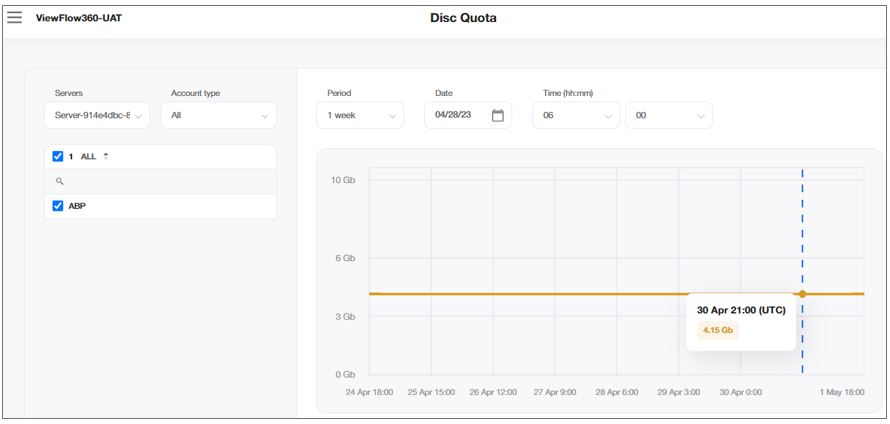
The X-axis shows the timestamp in the workflow file that identifies the disc quota at a certain period.
The Y-axis shows the parsed quota number + GB. This shows the parsed quota if multiple accounts, organization or server filters are selected.
You can view the chart for either a disc quota of 1 account or the sum of disc quotas of the accounts:
All - sum of the current disc quotas of all the accounts
Account- sum of the current disc quotas of the accounts that do not belong to an organization
Organization - sum of the current disc quotas of the accounts that belong to an organization
|
FIELD |
DESCRIPTION |
|
SERVERS |
Displayed ONLY for Root Administrator and Global Users. When you select the "Server", the "Account type" becomes active. |
|
ACCOUNT TYPE |
Account Types, such as All, Account, and Organization. |
|
PERIOD |
Defines the range to be displayed on the graph:
|
|
DATE |
Defines the end date of the range to be displayed on the graph. |
|
TIME |
Defines the end time of the range to be displayed on the graph. |
![]() ViewFlow retrieves the time of the server from the Monitoring Agent that sends the files and establishes the server time for the correct chart timings.
ViewFlow retrieves the time of the server from the Monitoring Agent that sends the files and establishes the server time for the correct chart timings.
![]() You must add and configure a new task in NewswayX to send disc quota to accumulate disc quota report.
You must add and configure a new task in NewswayX to send disc quota to accumulate disc quota report.
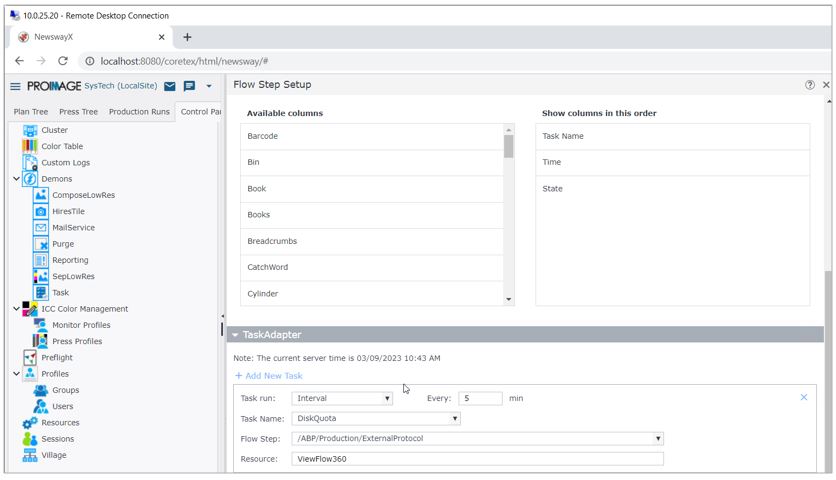
This creates a new XML and send to the folder:” D:\XML\Workflow files”.
XML Name: _nw_disk_Quota_2367.xml
The XML structure looks like this:

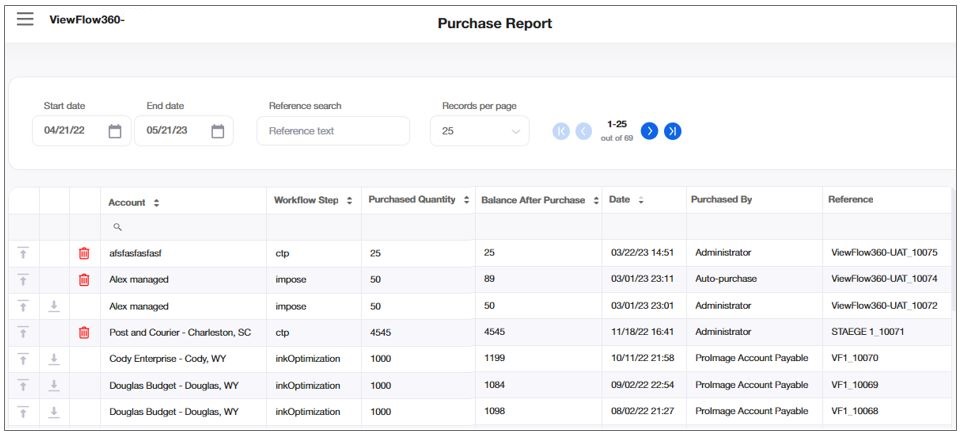
The purchase report displays the history of the credit purchases of all the accounts, per account and per flowstep.
You can select in the drop-down list in the Records per Page field, the number of table rows you want to display on the screen at a time. To browse through the pages, use the ![]()
![]() buttons.
buttons.
Set the period for which you want to display the data in the Start Date and the End Date fields.
Select ![]() in the account column to filter the displayed accounts.
in the account column to filter the displayed accounts.
Limit the display to specific references by typing characters in the reference name into the Reference Search dynamic search field.
|
FIELD |
DESCRIPTION |
|---|---|
|
ACCOUNT |
The account whose notification is displayed, as defined in the Company name field in |
|
WORKFLOW STEP |
The monitored flow step for which credit was purchased. |
|
PURCHASED QUANTITY |
Purchased credit (number of files which may be processed in that flow step). |
|
BALANCE AFTER PURCHASE |
Total credit after the purchase. |
|
DATE |
Purchase date. |
|
PURCHASED BY |
The user who made the purchase. |
|
REFERENCE |
Value comprised of the Server Name (set in the Administrator Account Parameters) and the purchase unique number (from 10001 on). For example, if the server name is VF1 and the purchase number is 10025, the reference is VF1_10025. |
|
UPLOAD |
Select the The invoice file size must be less than 1MB. |
|
DOWNLOAD |
Select the |
|
DELETE |
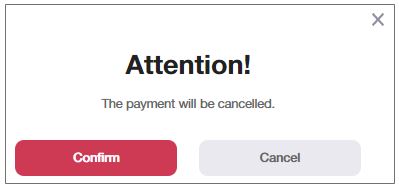
Delete a purchase lane. The By selecting to delete a purchase:
You can choose to continue with the deletion or to cancel it in the warning pop-up window:
|