ACCOUNT ADMINISTRATOR USER Guide
The root administrator or the global users with read/write permissions have the capability to define a representative user for each account (company) in ![]() > Accounts and Users > Accounts > your company >
> Accounts and Users > Accounts > your company > ![]() Edit Account.
Edit Account.
![]() IMPORTANT:
IMPORTANT:
The users defined in the Account Parameters can only access the data of their own company.
When you are defined as a new user in VF360, you receive a New Account notification from the VF360 support team at the email address set as your VF360 login name. For information regarding the login process, see Log into ViewFlow360.
To log into VF360, use the email address defined in the Email field and the password you set for yourself.
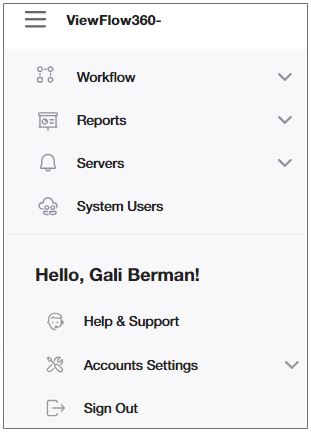
After you enter the system, to navigate among the VF360 screens, select the ![]() Menu icon and select the view you need. The default view is the Dashboard of your own company.
Menu icon and select the view you need. The default view is the Dashboard of your own company.
When you log into VF360, the default screen is the Dashboard, which offers a big picture of all the accounts you have permission to access and their essential information.
For information regarding the Workflow, see VF360 account admin system workflow.
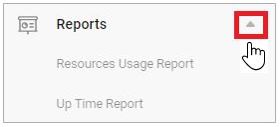
For information regarding the Reports, see VF360 account admin system reports.
For information regarding the Servers, see VF360 account admin system servers.
For information regarding the System Users, see VF360 account admin system users.
For information regarding the Profile and Monitoring Settings, see VF360 account settings.
The types of messages and notifications you receive are determined by the type of user you are (global user, account user, view-only user) and the notification options the administrator has selected for your user in VF360. For the complete set of messages, see The VF360 Notifications.
![]() Table sorting, filtering and search
Table sorting, filtering and search
Sort
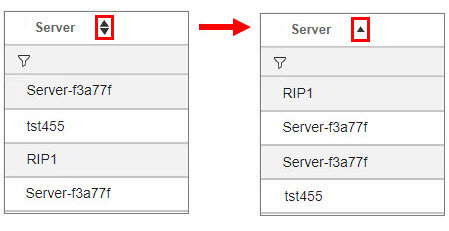
You can order the tables by the columns which include ![]() in the header.
in the header.
After you select the ![]() icon, the sorting icon turns into an ascending or descending icon, showing the sorting order. Select the
icon, the sorting icon turns into an ascending or descending icon, showing the sorting order. Select the ![]() or the
or the ![]() icon to modify the sorting order.
icon to modify the sorting order.
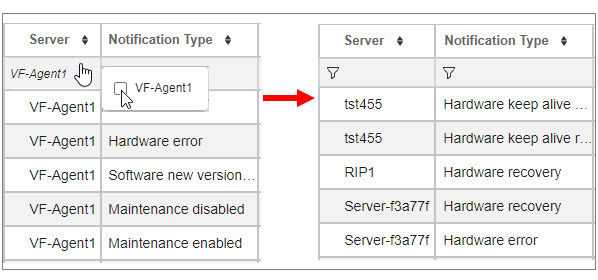
Filter
Limit the displayed items by filtering the display (![]() ).
).
For example, if you want to only display specific accounts, select the table cell where the ![]() icon is, and check the box/boxes of the account/accounts you want to display. Click outside the account list to implement the changes.
icon is, and check the box/boxes of the account/accounts you want to display. Click outside the account list to implement the changes.
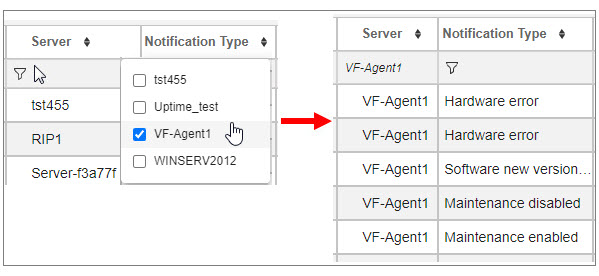
To cancel a filter selection, select the table cell where the accounts displayed are shown and deselect account name/names you do not want to display anymore. Click outside the account list to implement the changes.
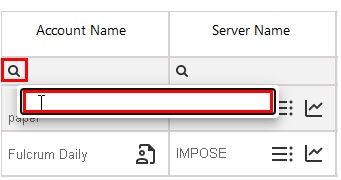
Search
The column search is not dynamic. Select the search icon ![]() , type the text you want to search for and press enter on your keyboard.
, type the text you want to search for and press enter on your keyboard.
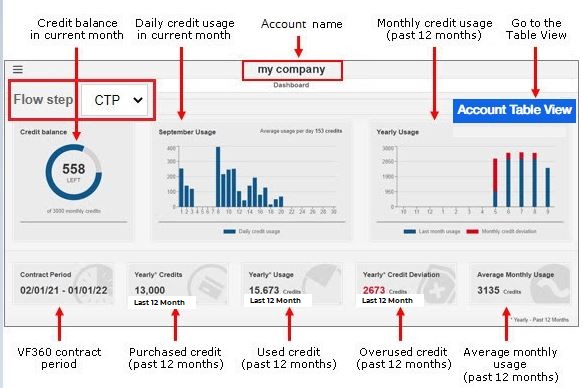
This view offers a graph representation of a few parameters, for the selected flow step.
![]() Select the flow step in the Flow step drop-down list.
Select the flow step in the Flow step drop-down list.
|
Field |
Description |
|---|---|
|
Flow Step |
Select the flow step whose statistics to display. |
|
Credit Balance |
The used and overused credit in the current month, taking into account the monthly allocated credit (the monthly number of credits you purchased for that flow step). The used credit appears in blue, while the overused credit, in red. |
|
[Current month] usage |
The daily credit usage in the current month. |
|
Yearly Usage |
The monthly credit usage for the past 12 months. In blue, the credits used within the monthly allocated (purchased) credit. In red, the overused monthly credit. |
|
Contract Period |
The start and expiration dates of the VF360 license. |
|
Yearly Credits |
The credit you have purchased over the past 12 months. |
|
Yearly Usage |
The credit you have actually used over the past 12 months. |
|
Yearly Credit Deviation |
The total number of credits you have used in addition to your purchased credit, over the past 12 months. |
|
Average Monthly Usage |
The monthly average used credit for the past 12 months. |
You can select the  option navigate from the Account Dashboard View straight to the Account Table View.
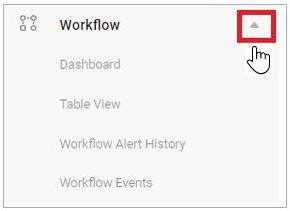
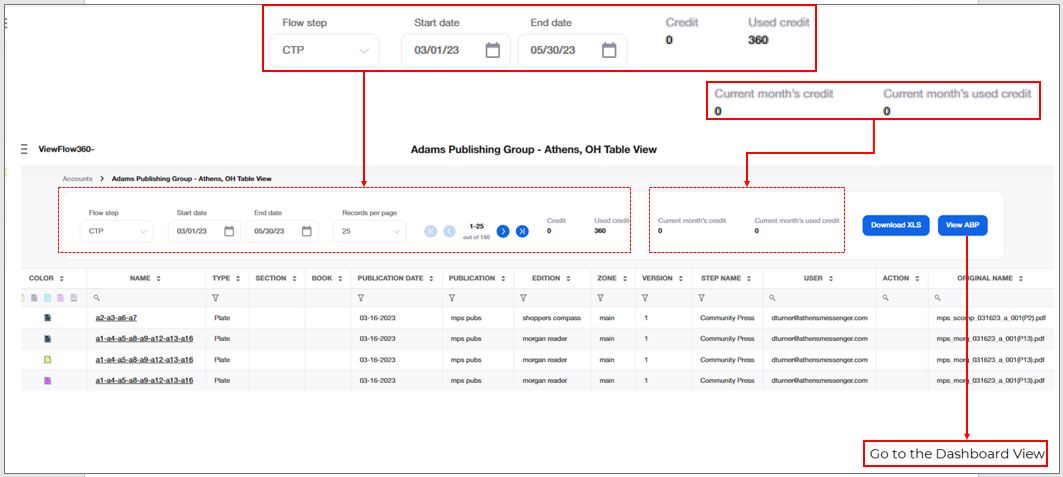
To view the activity of a specific flow step during a period of time, select ![]() > Workflow > Table View.
> Workflow > Table View.
|
Field |
Description |
|---|---|
|
flow step |
Select the flow step whose information to display. |
|
start date |
Set the first day of the period whose data to display. |
|
end date |
Set the last day of the period. The default is the past 24 hours. For example, if the current day is June 10th, the Start Day is June 9th and the End Day is June 10th. |
|
credit |
The number of credits (processed events) you have purchased for the selected period, for the selected flow step. |
|
Used Credit |
The number of events actually processed in this flow step, within the selected period. |
|
Current Month’s Credit |
The credit you have purchased for the current month. |
|
Current Month’s Used Credit |
The credit you have used in the current month. |
|
records Per Page |
The number of table entries displayed on the screen at a time. |
|
Of … Records |
The total number of recorded entries. |
|
object TYPE |
The event type processed in this flow step. The options are page, page separation, forme, forme separation, plate. |
|
name |
The name of the processed object, as it appears in Coretex. For example, 00B1 can be the number of a page. |
|
publication date |
The date of the publication of the processed event. |
|
publication |
The name of the publication of the processed event. |
|
edition |
The name of the edition of the processed event. |
|
zone |
The name of the zone of the processed event. |
|
version |
The version of the processed event. For example, the third version of a page is represented by the number 3. |
|
step name |
The name of the step which processes the event. |
|
user |
The user who performed the manual action. |
|
Action |
Enter the manual action performed in the flow step. |
|
original name |
The name of the file which arrives to the Coretex HotFolder. |
|
resource |
The resource which performs the processing. |
|
time |
The time the object was processed. |
|
DATE |
The date the object was processed. |
|
state |
The event status after processing. The status can be Passed ( |
|
OPTIONAL 1-5 |
Additional fields the administrator can add to the Table View for any flow step you monitor and rename them to suit your needs. The data for each optional parameter is retrieved from the Workflow XML file. |
![]() The default value of the past 24 hours is affecting both Start Date and End Date for the first time the Table View is opened. The following times the tool remembers the last selected flow step and the time period.
The default value of the past 24 hours is affecting both Start Date and End Date for the first time the Table View is opened. The following times the tool remembers the last selected flow step and the time period.
Most of the columns have a filtering option, using one of two types of filter:
A dynamic search filter, which searches for a specific string as you type it.
Filters which allow you to select value/values available in that column.
This table extracts the information it displays from the XML status reports it receives from the Coretex system for every processed event.
Below is an example of a status report for an event processed in the CTP1 flow step:
<?xml version="1.0" encoding="UTF-8" standalone="true"?>
<events xsi:noNamespaceSchemaLocation="events.xsd" xmlns:xsi="http://www.w3.org/2001/XMLSchema-instance"><event option5="" option4="" option3="" option2="" option1="" double_size="1" errorDescription="" state="ok" time="7:29:23" date="2023-04-17" time_stamp="2023-04-17 7:29:23" resource_name="LOCALMANAGER-PDFC-2" original_name="ABRN-061021-04-IE-NW-BS-R0.PDF" audit="" user="SysTech" workflowstep_name="PDF Pairing" workflowstep_type="impose" version="2" book="0_plates" section="" zone_name="ce" edition_name="abrn" publication_name="abrn" publication_date="2021-11-21" name="3_20" color="none" type="form" tenant_id="111111111" customer_name="ABP"/></events>
Select  to save the data for the selected time period into an Excel file and save the resulted file at a location of your choice.
Select  to navigate to the Account Dashboard.
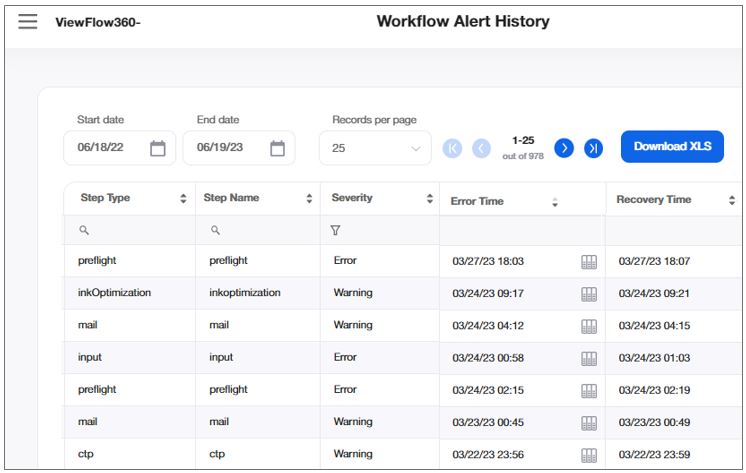
Use this alert view to monitor the history of all account' workflow errors for a given account for the period of time between the Start Date and the End Date.
Select in the drop-down list in the Records per Page field, the number of table rows you want to display on the screen at a time. To browse through the pages, use the ![]()
![]() buttons.
buttons.
Limit the display to a specific account by typing their name in the Account Search field.
|
FIELD |
DESCRIPTION |
|
STEP TYPE |
The type of flow step as defined in |
|
STEP NAME |
The type of flow step as defined in |
|
SEVERITY |
The severity defines the type of alert for each record: Error - the account is in error state. Warning - the account is in constant error state. Communication - the account is in no KeepAlive for hardware state. |
|
ERROR TIME |
The date and time values for the start time of an error state, in the account's time zone. |
|
RECOVERY TIME |
The date and time values for the end time of an error state, in the account's time zone. |
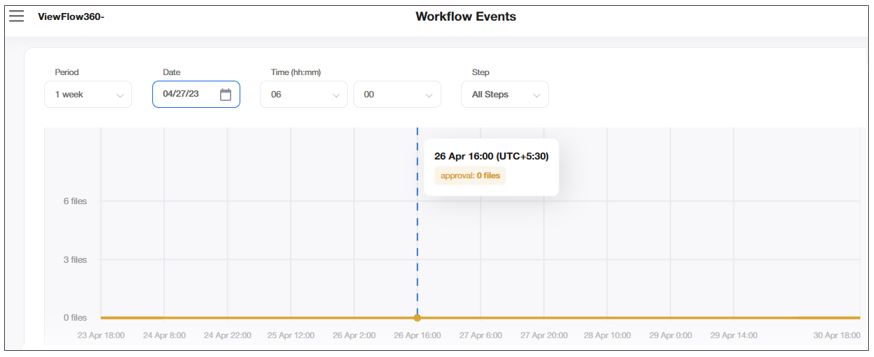
The Workflow Events allows you to see the number of workflow files utilized for every flow step in the system for the selected period to estimate the performance of the system.
![]() The number shown is the total of events per server and not per tenant.
The number shown is the total of events per server and not per tenant.
The user has one of the following roles:
Account
Account User
![]() For Admin, Global User, Monitoring User, and Organization Admin the “Workflow Files Monitoring” page is placed in the “Reports” main menu item.
For Admin, Global User, Monitoring User, and Organization Admin the “Workflow Files Monitoring” page is placed in the “Reports” main menu item.
![]() For Accounts, and Account Users the “Workflow Events" page is placed in the “Workflow” main menu item.
For Accounts, and Account Users the “Workflow Events" page is placed in the “Workflow” main menu item.
|
FIELD |
DESCRIPTION |
|
PERIOD |
For the Workflow Events , you can select any of the following options under the Period drop-down list.
|
|
DATE |
The date for the workflow event chart view. |
|
TIME |
The time for the workflow event chart view. |
|
STEP |
The flow step in the system for the selected period to estimate the performance of the system. You can select an appropriate step option from the drop-down list. |
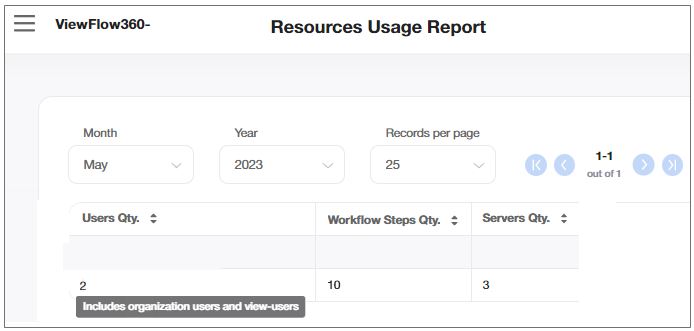
The Resources Usage Report allows you to review all data that was used in the system to get an overview of all system services used / grouped per services, dates, and users.
You can display the data in the alphabetic order of the account names.
You can select in the drop-down list in the Records per Page field, the number of table rows you want to display on the screen at a time. To browse through the pages, use the ![]()
![]() buttons.
buttons.
|
FIELD |
DESCRIPTION |
|
USERS QUANTITY |
The number of users usage. |
|
WORKFLOW STEPS QUANTITY |
The number of workflow steps usage. |
|
SERVERS QUANTITY |
The number of servers usage. |
The up time is the time a server or a software system is up and running. It is calculated based on the parameters reported by the monitoring agents.
The monitoring agent is a software program which is installed on different computers at the account's premises (for example the CTP computer, the RIP computer and so on) and monitors the activity of the CPU, memory, installed programs, and so on. The monitoring agent continuously sends a keep-alive type of signal to VF360, so that when that signal stops arriving at VF360, it means the server on which the monitoring agent is installed, is down. There are also keep-alive signals for software programs, which may or may not be identical to the server's keep-alive.
![]() For the monitoring agent to report keep-alive for a program, that program must also include the necessary software which connects it to the monitoring agent.
For the monitoring agent to report keep-alive for a program, that program must also include the necessary software which connects it to the monitoring agent.
The monitoring agent can also provide alerts when there is unusual activity on the computer, for example the CPU load or the memory usage are too high, the server is down, software programs have stopped working, and so on.
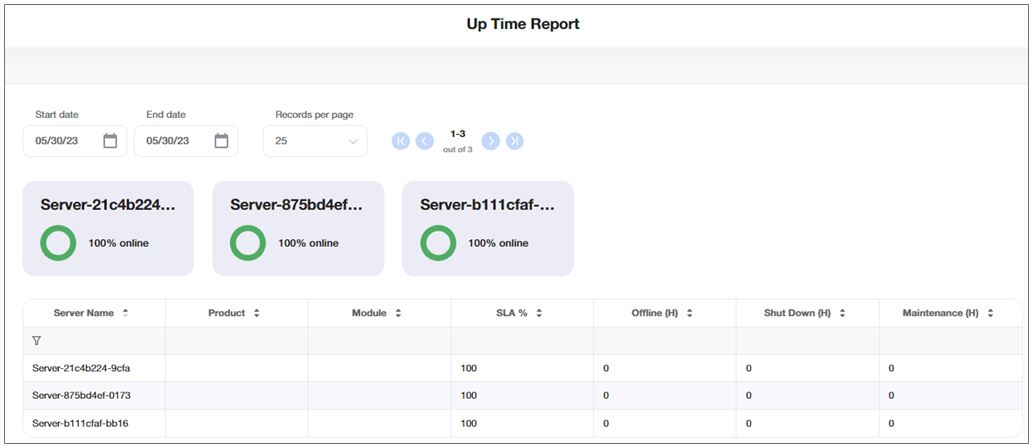
![]() Use the horizontal scroll bar to view all the uptime widgets.
Use the horizontal scroll bar to view all the uptime widgets.
|
FIELD |
DESCRIPTION |
|---|---|
|
START DATE |
The start date of the report's period. |
|
END DATE |
The end date of the report's period. |
|
SERVER NAME |
The name of the monitored server. |
|
PRODUCT |
The monitored software system. |
|
MODULE |
The monitored module inside the product. |
|
SLA% |
The service level agreement (SLA) is usually part of the contract between a service provider (for example a software developer) and its clients and measures the overall project performance, usually with industry-approved metric. The Up Time percentage guarantee is part of the SLA agreement and indicates the amount of time the computer is operational, the services are running and are accessible to the account. SLA = 100 - downTime / (totalTime - maintenanceTime - shutdownTime) * 100 |
|
OFFLINE (H) |
The downtime (measured in hours). |
|
SHUT DOWN |
The number of hours server was shut down during the selected period. |
|
MAINTENANCE |
The number of hours server had scheduled maintenance during the selected period. |
![]() You can order the table by each of the columns. You can also choose to filter the display (
You can order the table by each of the columns. You can also choose to filter the display (![]() ) to only show specific servers, systems, or modules. By limiting the display you also limit the number of widgets which appear on the screen, eliminating the need to scroll horizontally to see all of them.
) to only show specific servers, systems, or modules. By limiting the display you also limit the number of widgets which appear on the screen, eliminating the need to scroll horizontally to see all of them.
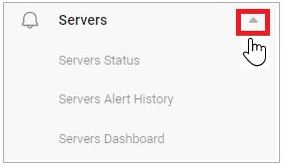
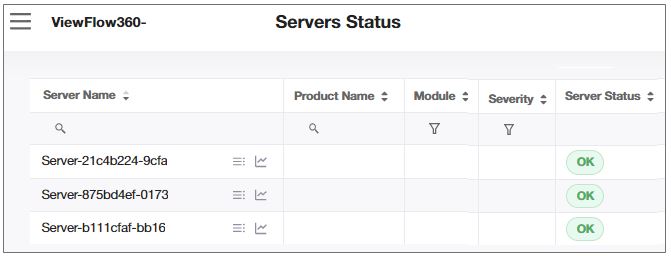
Monitor the activity of your in the Servers Status view.
|
FIELD |
DESCRIPTION |
|---|---|
|
SERVER NAME |
The name of the monitored server. |
|
PRODUCT NAME |
The name of the monitored software product. |
|
MODULE |
The name of the monitored module in the system. |
|
SEVERITY |
The severity defines the type of alert for each record: Error - the account is in error state. Warning - the account is in constant error state. Communication - the account is in no KeepAlive for hardware. Maintenance - the account is in maintenance state. Shut Down - the account is in graceful shutdown mode. |
|
SERVER STATUS |
The status of the monitored server:
|
![]()
Select the ![]() icon to open the server's alert history in a new tab and view all the alerts concerning that server in a time interval you choose in the Start date - End date fields.
icon to open the server's alert history in a new tab and view all the alerts concerning that server in a time interval you choose in the Start date - End date fields.
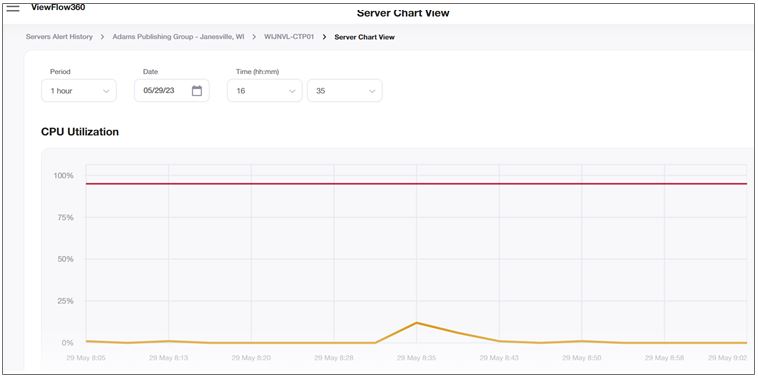
Select the ![]() icon to open the server chart view in a new tab, to observe activity of the CPU, memory, drivers and other components in a graph forme.
icon to open the server chart view in a new tab, to observe activity of the CPU, memory, drivers and other components in a graph forme.
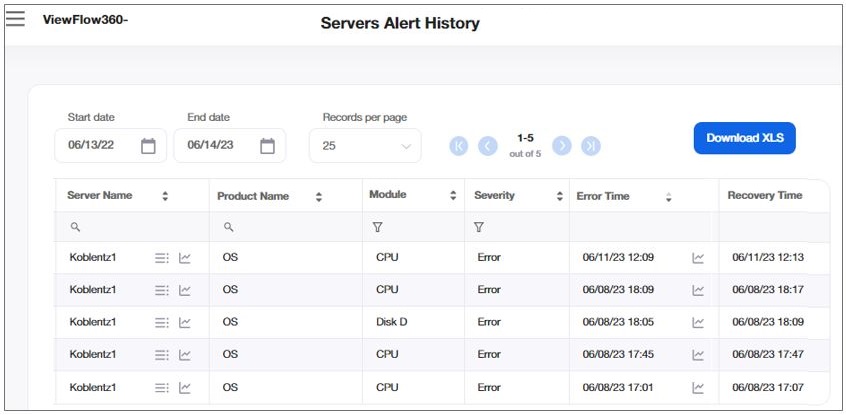
View the alert history of all your servers for a given account in the time interval you define between the Start Date and the End Date.
|
FIELD |
DESCRIPTION |
|
SERVER NAME |
The name of the monitored server, which runs the product. |
|
PRODUCT NAME |
The name of the monitored software system. |
|
MODULE |
The name of the monitored module within the product. |
|
SEVERITY |
The severity defines the type of alert for each record: Error - the account is in error state. Warning - the account is in constant error state. Communication - the account is in no KeepAlive for hardware state. Maintenance - the account is in maintenance state. |
|
ERROR TIME |
The date and time values for the start time of an error state, in the account's time zone. |
|
RECOVERY TIME |
The date and time values for the end time of an error state, in the account's time zone. |
Select the ![]() icon to open the server's alert history in a new tab and view all the alerts concerning that server in a time interval you have chosen.
icon to open the server's alert history in a new tab and view all the alerts concerning that server in a time interval you have chosen.
Select the ![]() icon to open the server chart view in a new tab, to observe activity of the CPU, memory, drivers and other components in a graph forme.
icon to open the server chart view in a new tab, to observe activity of the CPU, memory, drivers and other components in a graph forme.
The Servers Dashboard view helps you to review all available servers.
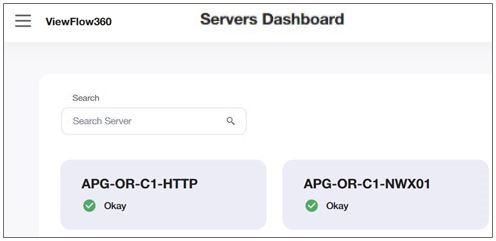
ViewFlow displays different icons based on the server status for each server:
Green circle - okay
Red circle - Hardware error
Red triangle - System error
Orange triangle - System warning
Orange circle - ‘No keep alive’
Blue circle - Maintenance mode
The following are the priorities for statuses reflection:
Maintenance
"No keep alive" status
System error
Hardware error
System warning
Okay
![]() Hovering on the respective server opens the option to open the “Server alert table” and Chart” and server status gets updated with a frequency of every two minutes.
Hovering on the respective server opens the option to open the “Server alert table” and Chart” and server status gets updated with a frequency of every two minutes.
|
FIELD |
DESCRIPTION |
|
Search SERVER |
ViewFlow displays each server on the page as a separate item. You can type a few characters of the server name that you intend to search and ViewFlow displays those server name along with server details, as appropriate. |
Each account can define its own list of account users who have permission to only view the Account Table View and the Dashboard View.
Select ![]() > System Users to view the users who have Read-Write and Read-only permission, or to add a new user with appropriate permissions.
> System Users to view the users who have Read-Write and Read-only permission, or to add a new user with appropriate permissions.
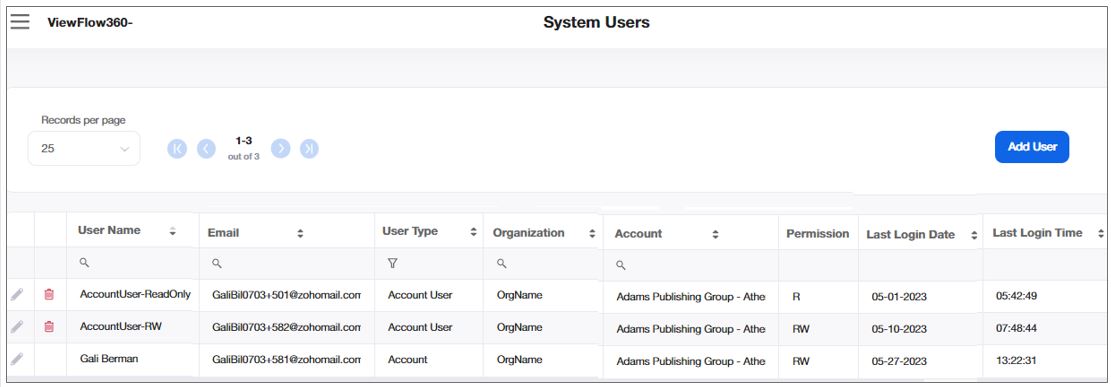
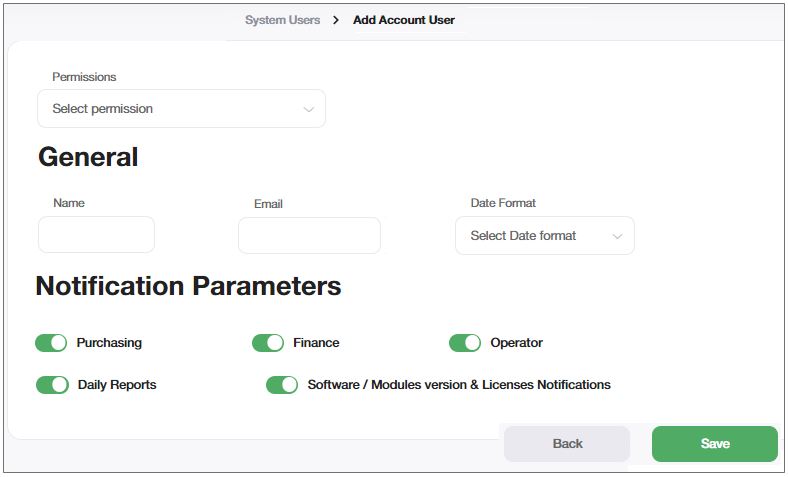
To add a user, select Add User > Account User and in the User section, enter the user’s permission, such as read only or read-write, name and email. This email is both for login and for notifications.
You must also select the date format the user sees in VF360. The options are day-month-year, or month-day-year.
If you want this user to receive reports, set the Purchasing, Finance, Operator, Daily Reports, and Software / Modules version & Licenses Notifications buttons to ON (![]() ). The default position is OFF (
). The default position is OFF (![]() ).
).
|
Field |
Description |
|---|---|
|
PERMISSIONS |
The access permission to be granted for the Account User, such as Read/Write or Read Only. |
|
NAME |
The name of the account user. |
|
|
The email id of the account user. |
|
DATE FORMAT |
The format of the date as it appears in VF360. The options are MM/DD/YYYY and DD/MM/YYYY. |
|
PURCHASING |
Turn this toggle button ON if you want the account user to receive email notifications:
|
|
FINANCE |
Turn this toggle button ON if you want the account user to receive email notifications on credit purchase, for a prepaid credit program. |
|
OPERATOR |
Turn this toggle button ON if you want the account user to receive email notifications:
|
|
DAILY REPORTS |
Turn this toggle button ON if you want the account user who also have the Daily Reports toggle button ON, to receive daily reports regarding workflows. |
|
Software / Modules version & Licenses Notifications |
Turn this toggle button ON if you want the account user to receive email notifications:
|
By providing appropriate inputs and clicking Save, the Account User is added to the respective Account.
Select Save to save the user.
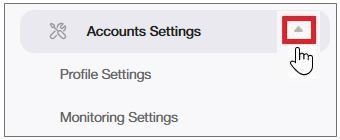
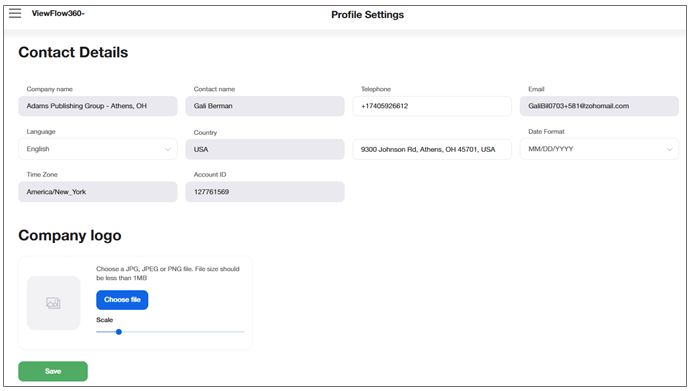
To access the Profile Settings, select ![]() > Accounts Settings > Profile Settings. You can view the information and even modify some of the fields (Telephone, Language, Address, Date Format, and the report parameters).
> Accounts Settings > Profile Settings. You can view the information and even modify some of the fields (Telephone, Language, Address, Date Format, and the report parameters).
Contact Parameters
|
Field |
Description |
|---|---|
|
Company name |
The name of the company which uses cloud Coretex services. |
|
contact name |
The name of the contact person. |
|
telephone |
The telephone number of the contact person. |
|
|
The email of the contact person, which is also their login name to VF360. |
|
language |
The language to use in the VF360 reports. |
|
country |
The company’s country. It is automatically filled in according to the address you enter. |
|
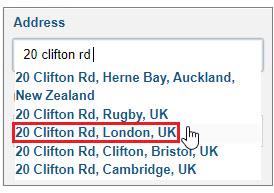
Address |
The company’s address. When you start typing the address, the auto complete function creates a drop-down list of possible addresses. After the address is complete, VF360 automatically fills in the Country and the Time Zone.
|
|
Date Format |
The format of the date as it appears in VF360. The options are MM/DD/YYYY and DD/MM/YYYY |
|
time zone |
The time zone of the account’s location. It is automatically filled in according to the address you enter. |
|
ACCOUNT ID |
Unique identification number a account has in the VF360, in the Product system, for billing activities, or in any other program which it is part of the software platform. If, for example, in the Apogee system Account1 has the Account ID 1234, they are assigned the same ID (1234) in VF360 also. Only an administrator can edit this number. As a account-type user, you can only view it. |
|
COMPANY LOGO |
Optional field. Insert the account’s logo, which subsequently appears on the reports. To add a logo, select Choose File and browse for the logo picture. It can be a JPG or PNG file, not larger than 1MB. You can Scale the picture to appear larger or smaller in the gray frame. |
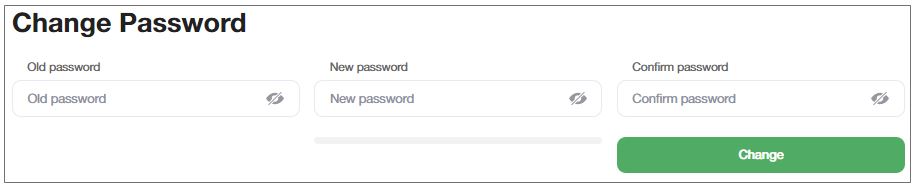
To change your password, enter the old password, the new password in the New password and Confirm password fields and select Change.
![]() To view/hide the password as you type it, select the
To view/hide the password as you type it, select the ![]() icon.
icon.
To access the Monitoring Settings, select ![]() > Accounts Settings > Monitoring Settings. You can view details, such as the report parameters, notification parameters, and flow steps and even modify some of the fields based on the access privileges.
> Accounts Settings > Monitoring Settings. You can view details, such as the report parameters, notification parameters, and flow steps and even modify some of the fields based on the access privileges.
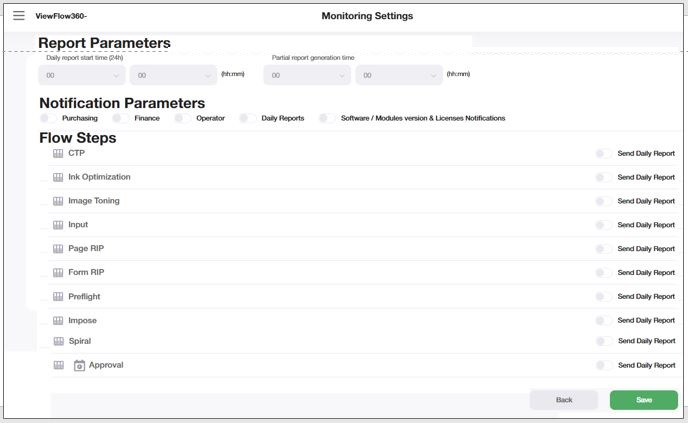
Report Parameters
Select the time (in hh:mm) when you want to issue the daily (24-hour) report. For example, if you select 16:00, the report is issued at 16:00, for the previous 24 hours.
VF360 can also issue a partial report, for part of the 24-hour cycle. For example, if you set the Partial Report Start Time at 10:00, VF360 issues a partial report at 10:00am, for the period between 16:00pm on the previous day, till 10:00am on the current day.
Notification Parameters
Define which reports the contact person receives.
|
Field |
Description |
|---|---|
|
PURCHASING |
Turn this toggle button ON if you want the account to receive email notifications:
|
|
FINANCE |
Turn this toggle button ON if you want the account to receive email notifications on credit purchase, for a prepaid credit program. |
|
OPERATOR |
Turn this toggle button ON if you want the account to receive email notifications:
|
|
DAILY REPORTS |
Turn this toggle button ON if you want the accounts who also have the Daily Reports toggle button ON, to receive daily reports regarding workflows. |
|
Software / Modules version & Licenses Notifications |
Turn this toggle button ON if you want the account to receive email notifications:
|
Flow Steps
You can see in this section the monitored flow steps of your company and you can turn the Send Daily Report button ON if you want your contact person to receive daily reports.
Select the option to navigate to a flow step's table view.
Select Save to implement the modifications.
The types of messages and notifications you receive are determined by the type of user you are (global user, account user, view-only user) and the notification options the administrator has selected for your user in VF360.
For the complete set of messages, see The VF360 Notifications.
 - server without active errors
 - server with active errors