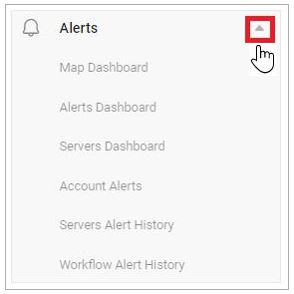
The VF360 MONITORING USER Alerts
![]() You can only see the alerts of the accounts you have permission for.
You can only see the alerts of the accounts you have permission for.
The Map Dashboard view allows you to see beside the geographic distribution and the status of your accounts, the global number of events processed in every flow step, for all the accounts together.
![]() In this view you cannot see information per account. You can see the graphs of up to five flow steps.
In this view you cannot see information per account. You can see the graphs of up to five flow steps.
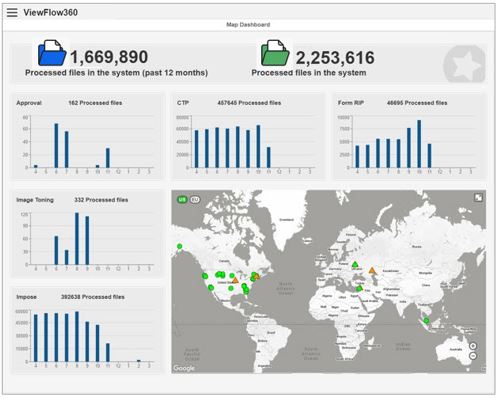
The Processed files in the system (past 12 months) parameter displays the number of events processed by all the monitored flow steps of all the accounts within the past 12 months, going back from the current date.
The Processed files in the system parameter displays the number of events processed by all the monitored flow steps of all the accounts since they started to use Coretex.
The tool displays five graphs at a time. Each graph shows the information for the previous 12 months, counting from the current month. The number on the X axis represents the serial number of the month in the calendar year, the last number on the right side being the current month (June in the example below).
The Y axis displays the total number of events processed in the selected flow step type, for all the accounts.
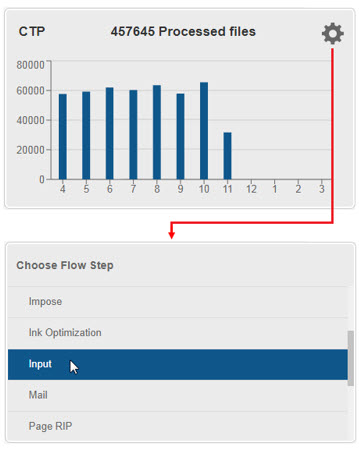
![]() In the graphs, the flow step name is in fact the flow step type, regardless of the actual name of the input flow step in the different workflows. For example, the type is Input, although in the workflow it might be named PDF In, or HotFolder, or FileIn, and so on.
In the graphs, the flow step name is in fact the flow step type, regardless of the actual name of the input flow step in the different workflows. For example, the type is Input, although in the workflow it might be named PDF In, or HotFolder, or FileIn, and so on.
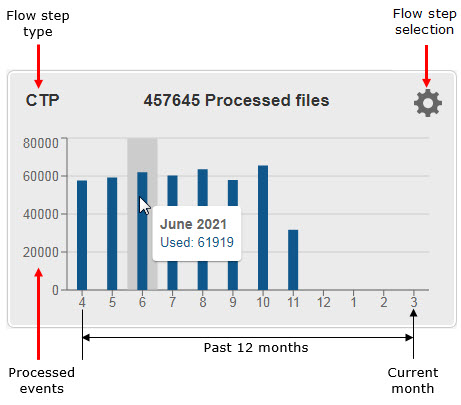
To see the information on a specific month, hover your mouse over its bar in the graph and view the tooltip.
To change the flow step type, hover your mouse over the graph and select the ![]() icon. In the Choose Flow Step screen, select the required flow step type.
icon. In the Choose Flow Step screen, select the required flow step type.
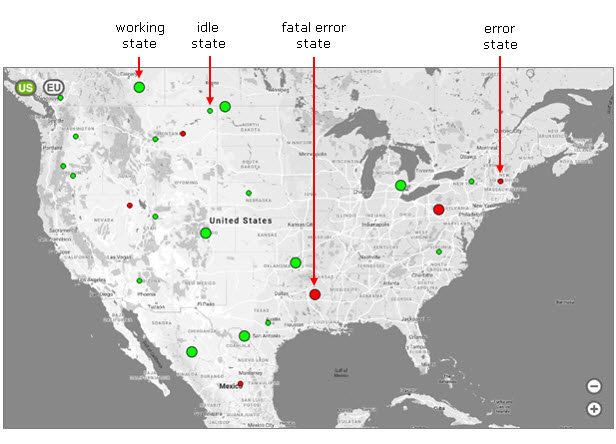
The map displays the location and the status of your accounts, as transmitted by the Coretex StatusReportAdapter of each monitored flow step of each account.
Hover your mouse over a vertical graph bar to view the month and the processed file number.
You can zoom in (![]() ), zoom out (
), zoom out (![]() ), move the map to display another region (
), move the map to display another region (![]() ), select full screen view (
), select full screen view (![]() ).
).
For workflow
|
WORKFLOW STATE |
DESCRIPTION |
|---|---|
|
Working state (FLASHING green DOT) |
An account is in working state if they have at least a predefined number of events successfully processed in two minutes. The system administrator defines the number of events in |
|
Idle state (steady green DOT) |
An account is in idle state if they have not processed any event for at least a predefined period of time. The system administrator defines the number of events in |
|
Error state (Steady red DOT) |
An account is in error state if they have at least a predefined number of events ending in error in a two-minute period. The system administrator defines the number of events in An account is considered back in working state if there are no errors for at least a predefined number of minutes. The administrator sets this number of minutes in |
|
CONSTANT ERROR STATE (FLASHING RED DOT) |
An account is in this error state if at least a predefined number of events ended in error in a two-minute interval. The system administrator defines the number of events in An account is considered back in working state if there are no errors for at least a predefined number of minutes. The administrator sets this number of minutes in |
|
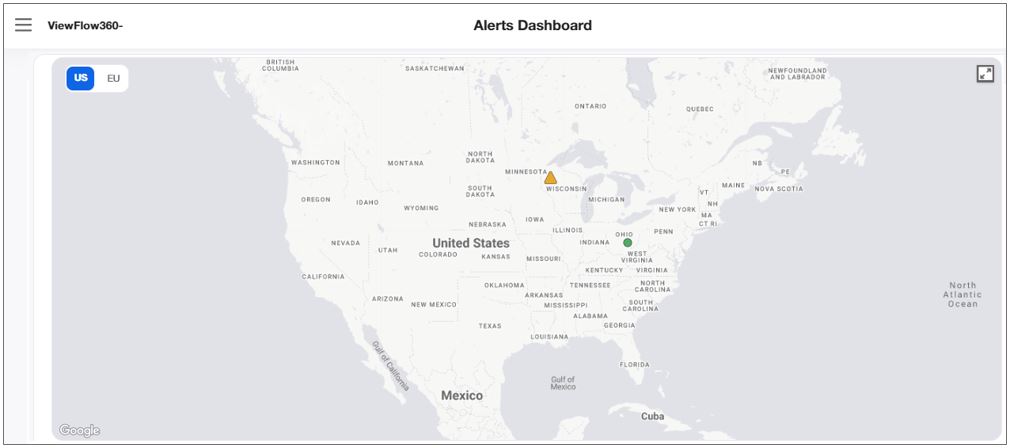
NO KEEP ALIVE FOR WORKFLOW (FLASHING ORANGE DOT) |
For a account to send a keep alive signal, the Workflow KeepAlive monitoring toggle switch must be ON in An account is in this state if it does not send a keep alive signal to VF360 for a predefined number of minutes. The administrator sets this number in |
Server alerts
|
SERVER ALERTS |
DESCRIPTION |
|---|---|
|
ACTIVE SERVER ERROR (RED TRIANGLE) |
This is a hardware alert. The Agent application permanently monitors the OS usage (CPU, memory, disks), as well as the usage of up to five specified folders on the system it is installed on. If the usage exceeds the limit set for the parameters, an error alert is issued. The system administrator defines the limits in |
|
NO KEEP ALIVE FOR HARDWARE (FLASHING ORANGE TRIANGLE) |
The agent installed on the account's server periodically sends KeepAlive messages, at time intervals the system administrator sets in The system administrator defines the time interval after which, if no new KeepAlive message arrives, a No KeepAlive alert is sent, in |
|
MAINTENANCE MODE ON (BLUE DOT) |
The account has the Maintenance mode ON for a specific server. |
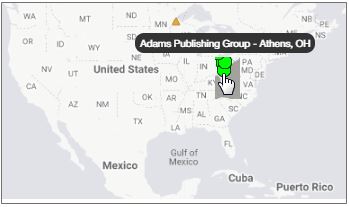
Hover your mouse over a green circle which represents the location of an account to see in a tool tip its name and location.
From the Map Dashboard view, select a account's icon to navigate to its Table View, to its Production System, to its Server Table (the server's alert history), its Workflow Table (the workflow's alert history), and so on. The navigation target depends on the account's state.
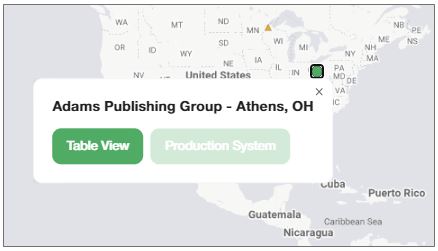
From an account in constant error, you can navigate to Table View and to Production System.
From an account with active server error , you can navigate to Server Table (server alert history) and to Server Chart (chart view).
From an account in a No KeepAlive for Workflow state, you can navigate to its Workflow Alert History.
From an account in a No KeepAlive for Hardware state, you can navigate to its Servers Alert History.
The Alerts Dashboard view helps you monitor your accounts' workflow steps and servers based on their geographical distribution.
Monitor the statuses of your servers in the Account Alerts tables.
The data appears in the alphabetic order of the account names.
You can select in the Records per Page field the number of table rows you want to display on the screen at a time.
To browse through the pages, use the ![]()
![]() buttons.
buttons.
You can also search a specific account in the Account search bar (dynamic search).
Each row in the table represents a account, for which you can see the name and the number of servers with active errors. For example, 3 active errors means there are three servers with active errors.
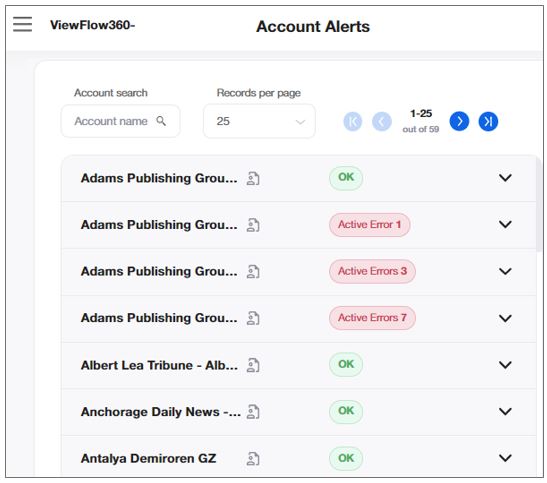
To find further details regarding the servers of a specific account, select the down arrow ![]() in the account's row.
in the account's row.
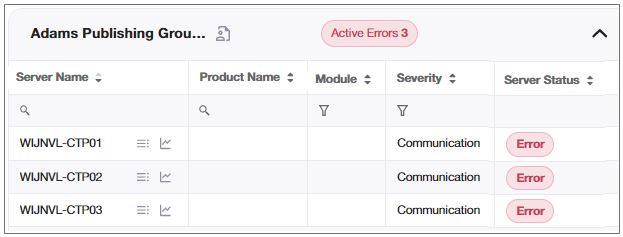
Select the up arrow ![]() to hide the account's server table.
to hide the account's server table.
|
FIELD |
DESCRIPTION |
|---|---|
|
SERVER NAME |
The name of the monitored server. |
|
PRODUCT NAME |
The name of the monitored software system. |
|
MODULE |
The name of the monitored module in the system. |
|
SEVERITY |
The severity defines the type of alert for each record: Error - the account is in error state. Warning - the account is in constant error state. Communication - the account is in no KeepAlive for hardware. Maintenance - the account is in maintenance state. |
|
SERVER STATUS |
The status of the monitored server:
|
![]()
Select the ![]() icon to navigate to an account's server alert table.
icon to navigate to an account's server alert table.
Select the ![]() icon to open the alert history of a specific server in a new tab.
icon to open the alert history of a specific server in a new tab.
Select the ![]() icon to open the server chart view in a new tab, to observe activity of the CPU, memory and other components in a graph forme.
icon to open the server chart view in a new tab, to observe activity of the CPU, memory and other components in a graph forme.
Use this alert history to view all the accounts' server errors for the period of time between the Start Date and the End Date.
You can display the data in the alphabetic order of the account names, by the start date or by the end date.
Select in the drop-down list in the Records per Page field, the number of table rows you want to display on the screen at a time.

|
FIELD |
DESCRIPTION |
|---|---|
|
ACCOUNT NAME |
The name of the account, as defined in the Company name field in |
|
SERVER NAME |
The name of the monitored server, which runs the product. |
|
PRODUCT NAME |
The name of the monitored software system. |
|
MODULE |
The name of the monitored module within the product. |
|
SEVERITY |
The severity defines the type of alert for each record: Error - the account is in error state. Warning - the account is in constant error state. Communication - the account is in no KeepAlive for hardware state. Maintenance - the account is in maintenance state. |
|
ERROR TIME |
The date and time values for the start time of an error state, in the account's time zone. |
|
RECOVERY TIME |
The date and time values for the end time of an error state, in the account's time zone. |
![]()
Select the  icon to export the details to an Excel file.
Select the ![]() icon to open the server chart view in a new tab, to observe activity of the CPU, memory and other components in a graph forme.
icon to open the server chart view in a new tab, to observe activity of the CPU, memory and other components in a graph forme.
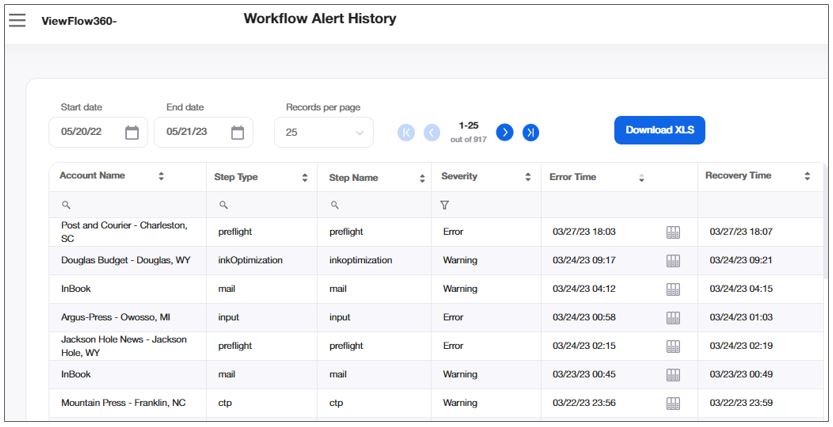
Use this alert view to monitor the history of all account's workflow errors for the period of time between the Start Date and the End Date.
Select in the drop-down list in the Records per Page field, the number of table rows you want to display on the screen at a time. To browse through the pages, use the ![]()
![]() buttons.
buttons.
Limit the display to a specific account by typing their name in the Account Search field.
|
FIELD |
DESCRIPTION |
|---|---|
|
ACCOUNT NAME |
The name of the account, as defined in the Company name field in |
|
STEP TYPE |
The type of flow step as defined in |
|
STEP NAME |
The type of flow step as defined in |
|
SEVERITY |
The severity defines the type of alert for each record: Error - the account is in error state. Warning - the account is in constant error state. Communication - the account is in no KeepAlive for hardware. |
|
ERROR TIME |
The date and time values for the start time of an error state, in the account's time zone. |
|
RECOVERY TIME |
The date and time values for the end time of an error state, in the account's time zone. |
 - server without active errors
 - server with active errors